Crypto for Beginners & Current Outlook 03.09.2026 | Bitcoin and Ethereum | Informative
📌 Crypto Market Summary BTC & ETH
| Instrument | Price (USD) |
|---|---|
| BTC/USD | 77608.29 |
| ETH/USD | 2392.94 |
Explore BTC and ETH technical outlooks with key support, resistance levels, potential scenarios, and essential risk management strategies for informed trading.
📦 Critical Levels BTC & ETH
Note: Levels are "near band" support/resistance calculated from the current price (not signals).
| Instrument | Support 1 | Support 2 | Resistance 1 | Resistance 2 |
|---|---|---|---|---|
| BTC/USD | 76832 | 76056 | 78384 | 79160 |
| ETH/USD | 2364 | 2336 | 2422 | 2450 |
⚡ Executive AI Summary
BTC/USD hovers near its daily open and approaches a resistance cluster formed by recent equal highs around 77,600-77,700, signaling a likely liquidity sweep if bulls attempt further extension. ETH/USD reflects consolidation just above daily lows, indicating potential accumulation but lacking impulsive momentum to push beyond 2,400. Both instruments face volatility pressure amid session overlaps, with risk appetite delicately balanced against DXY strength. Traders should monitor these structural levels closely for breakout or rejection cues while being wary of false moves driven by emotional trading during thin liquidity periods.
Risk Sentiment and Dollar Index Influence on Crypto Markets
The current market environment remains perched between risk-on enthusiasm and risk-off caution as geopolitical tensions and macroeconomic data continue to inject uncertainty. This equilibrium is fragile; thus, cryptocurrencies like Bitcoin and Ethereum are particularly susceptible to shifts in global risk appetite. The US Dollar Index (DXY) currently trades with modest strength, exerting subtle downward pressure on crypto assets priced in USD through broader portfolio rebalancing flows. As the DXY maintains an elevated footing near critical technical junctures, it dampens speculative influx into riskier digital assets despite episodic spikes in volatility associated with trading session overlaps. This relationship underscores the inverse dynamic where dollar appreciation curtails crypto gains by elevating the opportunity cost of holding non-yielding assets denominated in dollars. Consequently, Bitcoin’s current price level near 77,608 faces resistance aligned with this macro backdrop that tempers bullish conviction.📅 Economic Calendar and Key Drivers
Upcoming US employment data alongside Federal Reserve commentary remain pivotal focus points for traders gauging inflation trajectories and monetary policy stance. Surprises here could quickly reshape the dollar’s trajectory and ripple through cryptocurrencies by altering risk sentiment dramatically. Additionally, any unexpected geopolitical developments or regulatory announcements impacting blockchain technologies could ignite sharp directional moves given the fragile baseline in price structure. Market participants should monitor session overlap periods carefully as these times historically coincide with heightened volatility due to converging liquidity from multiple time zones. These windows often produce rapid liquidity sweeps around key structural price levels — precisely what BTC/USD at its daily high zone of ~77,700 is vulnerable to today.The Behavioral Trap: Psychology & Discipline in Crypto Trading
Emotional decision-making frequently leads traders astray within crypto markets notorious for their pronounced volatility and sudden swings. The temptation to chase breakouts or react impulsively after sharp intraday moves often results in unplanned trades that erode capital rather than accumulate it. Maintaining discipline amid such noise requires recognizing when market structure remains ambiguous—as is presently evident on higher timeframes for both Bitcoin and Ethereum. Patience serves as a critical virtue; waiting for confirmed breaks beyond equal highs or lows before committing sizable positions can mitigate exposure to false breakouts or retracements designed to capture stop-loss clusters. This disciplined approach preserves flexibility while enabling participation once market momentum aligns clearly with technical evidence rather than transient emotion-driven anomalies.Common Execution Mistakes Undermining Crypto Profitability
One prevalent error emerges from misreading equal high/low zones—key liquidity areas where stop orders cluster—leading many traders to prematurely enter positions before these zones have been tested for exhaustion or sweep confirmation. Jumping into the market without acknowledging the possibility of Judas swings risks getting caught on the wrong side during volatile corrections that temporarily breach these levels. Further compounding this issue is neglecting session overlap-induced volatility spikes which can distort short-term price action signals if interpreted without context. Traders often mistake minor retracements within these periods for trend reversals rather than standard correction legs embedded within larger structures. Such misinterpretations increase churn and elevate psychological stress unnecessarily.Macro Context: How Global Forces Shape Crypto’s Near-Term Path
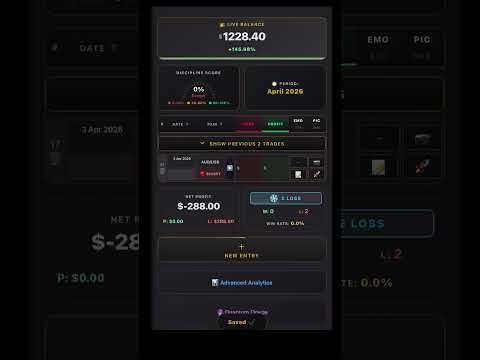
⚡ Elevate Your Trading Edge
Stop guessing and start auditing. Log your SMC & ICT setups, analyze your psychology, and master your risk with FXmans PRO Trading Journal.
Discover PRO →Volatility Dynamics Amid Risk Appetite Fluctuations
Volatility emerges as both an opportunity and hazard under today’s delicate risk landscape where marginal shifts can amplify price movements profoundly across crypto markets. Session overlaps—particularly between Asian-European and European-US trading hours—serve as crucibles intensifying volume surges that trigger brief but intense bouts of price exploration around key support/resistance bands. Instruments like BTC/USD are thus prone to rapid directional tests near daily highs/lows which act as magnets for liquidity-hunting algorithms seeking stops clustering just beyond visible barriers. Ethereum similarly shows tentative positioning slightly above its daily low (~2390), suggesting preparatory build-up before a potential directional impulse aligned with overall market mood shifts dictated by external macro variables including DXY fluctuations.A Technical Lens: Structural Levels Define Next Moves
Bitcoin's current trading around 77,608 places it just below a robust supply zone created by prior swing highs clustered close together—a classic setup inviting either a false breakout above these equal highs or a rejection prompting retracement toward interim supports near 76,500-76,800 range which coincides with intraday pivot points. Ethereum's scenario mirrors this indecision with prices consolidating close to its daily low boundary without clear volatility expansion conducive to breakouts beyond 2,400 USD resistance overhead at present moment. Both charts reflect correction legs more than impulsive trends right now; hence traders should look for confirmed breaches accompanied by volume validation before asserting directional bias firmly either way. Support-resistance dynamics forming between recent equal highs/lows underpin potential liquidity sweeps that will clarify whether buyers absorb selling pressure decisively or sellers capitalize on failed rally attempts common during overlapping sessions when algorithmic activity peaks unpredictably. This setup favors strategic patience over aggressive entry until clear structural resolution emerges validating pursuit of sustained directional trades instead of reactive scalping prone to whipsaws caused by transient emotional impulses circulating amongst retail participants especially during volatile sessions.Trader BIOS
Market mode: Mixed — cautious approach warranted given unsettled structure Assets with buying pressure: Monitor BTC if it convincingly clears above 77,700 high cluster Assets with selling pressure: Potential downside in ETH below support zone near 2,380 Pairs to avoid: Avoid aggressive longs/sells prematurely on ETH/USD until range breakout confirmation This is not investment advice. Market conditions may invalidate scenarios presented here; sometimes doing nothing is better than trading when clarity eludes directionality amidst elevated crypto volatility combined with fragile global risk sentiment dynamics.📚 Previous Crypto Analyses
- Crypto Scenarios 02.09.2026 | Potential Directions & Key Zones in Bitcoin and Ethereum | Educational
- Crypto for Beginners & Current Outlook 01.09.2026 | Bitcoin and Ethereum | Scenario
- BTC & ETH Guide & Current Analysis 31.08.2026 | How to Read Crypto Technically? | Educational
📌 FXmans Links
🌍 FXmans Main Blog
📡 Telegram Channel
📁 Forex Articles Archive
🟢 WhatsApp Channel





Comments