Forex Strategy Logic 26.06.2026 | Setup, Scenarios & Discipline in DXY and Majors | Market-psychology
📌 Current Market Summary Live Snapshot
| Instrument | Price | Note |
|---|---|---|
| EUR/USD | 1.13749 | Strong USD |
| GBP/USD | 1.31998 | Strong USD |
| USD/JPY | 161.634 | Strong USD |
| XAU/USD | 4009.07 | Gold (Ounce) – volatile |
| DXY | 101.40 | US Dollar Index |
Analyzing key forex pairs reveals critical support and resistance levels; developing scenarios with disciplined risk management is essential for strategic.
📦 Critical Levels Near Support / Resistance
Note: Levels are "near band" support/resistance calculated from the current price (not pivot/OHLC).
| Instrument | Support 1 | Support 2 | Resistance 1 | Resistance 2 |
|---|---|---|---|---|
| EUR/USD | 1.13464 | 1.1318 | 1.14033 | 1.14318 |
| GBP/USD | 1.31668 | 1.31338 | 1.32328 | 1.32658 |
| USD/JPY | 161.15 | 160.665 | 162.119 | 162.604 |
| XAU/USD | 3985.01 | 3960.96 | 4033.12 | 4057.17 |
| DXY | 101.15 | 100.9 | 101.66 | 101.91 |
⚡ Executive AI Summary
EUR/USD hovers near its daily open and just below the liquidity cluster at 1.13843, signaling a potential short-term sweep above that level before a correction leg. GBP/USD’s tight range around 1.320 reflects balanced order flow with a slight bias toward selling pressure as price struggles to clear the daily high liquidity zone at 1.32079. USD/JPY remains trapped beneath its daily open and high, exhibiting a corrective pullback within a broader bullish structure, eyeing support near 161.525 for possible re-engagement. Gold’s consolidation near the critical 4009 level amid rising safe-haven demand suggests accumulation ahead of directional resolution linked to USD strength and risk appetite shifts.
Is the market setting up for deceptive liquidity sweeps in major FX pairs today?
The technical picture as of June 26 reveals markets operating within narrow ranges close to daily opens but testing critical liquidity zones that can trigger sharp, deceptive moves. EUR/USD currently trades at 1.13749, slightly below its daily open of 1.13779 and near the key resistance defined by the day’s high at 1.13843 — an area where stop-loss hunting or inducements could emerge before larger directional impulses materialize. This proximity to the upper liquidity pool points toward potential fake breakout attempts designed to sweep stops before initiating corrective retracements. GBP/USD mirrors this pattern with price oscillating narrowly between its low of 1.31811 and high of 1.32079 while resting just beneath the daily high at 1.32079 after opening at 1.31966. The inability to decisively breach this upside liquidity cluster suggests entrenched selling interest or candidate sellers waiting for confirmation from broader market cues such as risk sentiment or US dollar momentum changes. USD/JPY trades slightly below its open (161.747) at around 161.634 and is poised between daily low (161.525) and high (161.850). This range compression adjacent to critical order blocks hints at an ongoing battle between bulls attempting to reclaim higher ground and bears defending lower levels potentially seeking a deeper correction before continuation.📅 Economic Calendar and Key Drivers
Global macro factors underpinning current price action include persistent safe-haven demand amid geopolitical tensions and mixed economic data releases from developed economies impacting investor positioning across currency markets. The US dollar index at 101.40 faces crosswinds from inflation readings that oscillate expectations on Federal Reserve policy tightening versus pauses, resulting in muted directional conviction. Bond yields have shown bouts of volatility as traders anticipate whether hawkish rhetoric will translate into sustained yield curve steepening or flattening scenarios amid calls for central banks’ caution given slowing growth signals outside the US economy. Risk appetite fluctuates with intermittent spikes in volatility, driving periodic flows into perceived safer currencies like JPY and CHF while weighing down pro-cyclicals such as AUD, CAD, or commodity-linked currencies like SEK due to global supply chain uncertainties.Analyzing Possible Market Scenarios Amid Current Technical Context
One viable scenario involves EUR/USD attempting an initial false breakout above the intra-day high of 1.13843 to capture stop liquidity but failing to sustain momentum beyond this level—triggering a retracement toward recent lows near the day’s low at 1.13572 before resuming sideways consolidation until fresh catalysts arrive. In GBP/USD, traders should watch for potential rejection at or just above today’s high around 1.32079; failure here may lead to pressure back down toward intraday support near 1.31811-1.3190 levels as participants digest UK economic releases alongside ECB guidance on policy stance impacting Eurozone-UK cross flows indirectly. USD/JPY could extend its corrective phase if it breaches intraday support further below recent lows but may also find renewed buying interest if it holds above key levels around 161-162 area reflecting ongoing safe-haven bids amid global uncertainty. Gold prices remain anchored near $4009 per ounce despite dollar stability; however, any sudden shifts in risk preference toward risk-off environments are likely to ignite gold upside momentum given its inverse correlation with real rates and USD strength dynamics over short-term horizons.XAU/USD: Gold’s Role in Balancing Risk-Off Flows
Gold trading just above $4009 signals an equilibrium stage influenced by competing forces: persistent safe-haven interest versus marginally firmer dollar dynamics limiting extended rallies so far today. The precious metal is uniquely sensitive given recent episodes where dips were swiftly bought amidst equity market jitters or geopolitical flare-ups causing spikes in implied volatility across asset classes globally—this interplay creates fertile ground for sharp but transient gold moves linked directly to changing perceptions about inflation trajectories versus monetary policies ahead. Traders monitoring XAU/USD should remain alert for acute price reactions surrounding technical clusters especially if DXY breaks decisively either side of current ranges which historically tend to amplify gold swings through correlated funding cost adjustments and speculative positioning unwinds alike.Common Trading Pitfalls During Elevated Volatility Phases
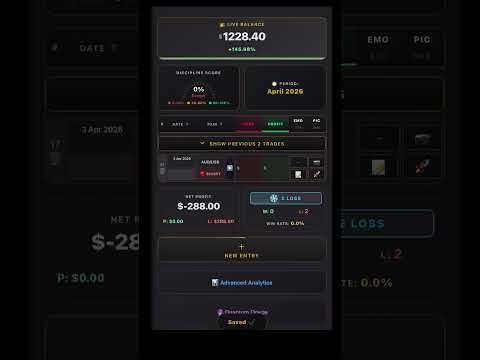
🧠 Master Your Psychology
The best traders track their emotions. Use the advanced analytics in FXmans PRO to find your most profitable market sessions and eliminate toxic habits.
Start Journaling →Strategic Considerations: When Staying Out Beats Trading
Given current ambiguity surrounding structural clarity across multiple timeframes coupled with rising volatility risks triggered by looming economic events or geopolitical developments, discretionary restraint is advisable until confirmed directional conviction emerges accompanied by volume validation through decisive breaches beyond identified liquidity zones like EUR/USD’s upper cluster near 1.13843 or GBP/USD’s intraday ceiling close to 1.32079. Patience becomes especially valuable when markets exhibit tight range-bound behavior juxtaposed with periodic spikes that create noise rather than trend initiation; capital preservation strategies often outperform attempts chasing fleeting impulsive legs lacking robust follow-through under these circumstances. Traders must calibrate position sizing meticulously while maintaining flexible exit plans aligned with evolving risk profiles dictated by unexpected policy announcements or shock events fundamentally altering prevailing sentiment drivers mid-session without warning. This analysis highlights how cautious interpretation combined with selective engagement based on structural triggers enhances probabilistic edges amidst complex environment setups dominated by deceptive liquidity sweeps rather than straightforward breakouts.📅 Economic Calendar and Key Drivers
Today’s focus includes monitoring European Central Bank speeches alongside US durable goods orders data anticipated later—both capable of jolting already fragile sentiment balances affecting EUR/USD—and GBP/USD via indirect channel effects stemming from changing yield differentials tied closely to Fed versus BoE narrative shifts on future rate paths amid inflationary pressures subsiding unevenly across geographies. Additionally, USD/JPY remains sensitive ahead of BoJ statements expected next week alongside unchanged ultra-loose monetary stances influencing Japanese government bond yields that underpin currency valuations especially during global risk-off episodes favoring JPY accumulation phases intermittently observed recently due to overarching uncertainty themes still dominating international capital flows broadly shaping FX landscapes well into Q3 cycles unfolding now. Trader BIOS Market mode: Mixed-to-cautious given elevated volatility risks Assets showing buying pressure: JPY (safe haven), Gold (XAUUSD) on dips Assets facing selling pressure: EUR (versus USD), GBP (near resistance), Commodities-linked FX weak vs USD Pairs advised for avoidance: Avoid aggressive breakout plays on EUR/USD & GBP/USD until confirmed clear structure emerges .This is not investment advice.📚 Previous Forex Analyses
- Forex Analysis 25.06.2026 | DXY, EUR/USD, GBP/USD: Market Logic & Critical Levels | Educational
- Forex Strategy Logic 23.06.2026 | Setup, Scenarios & Discipline in DXY and Majors | Scenario
- Forex Strategy Logic 22.06.2026 | Setup, Scenarios & Discipline in DXY and Majors | Informative
📌 FXmans Links
🌍 FXmans Main Blog
📡 Telegram Channel
📁 Forex Articles Archive
🟢 WhatsApp Channel


Comments